Recently I have been banging my head trying to import a ton of OCR acquired data expressed in tabular form. I think I have come up with a neat approach using probabilistic reasoning combined with mixed integer programming. The method is pretty robust to all sorts of real world issues. In particular, the method leverages topological understanding of tables, encodes it declaratively into a mixed integer/linear program, and integrates weak probabilistic signals to classify the whole table in one go (at sub second speeds). This method can be used for any kind of classification where you have strong logical constraints but noisy data.
Plain text tables are quite interesting when encountered in the wild. They are highly compressed forms of data, but that’s a double edged sword, you can only understand the meaning of a particular table element if, and only if, you understand the meaning of the row and column it is found within. Unfortunately, the meaning of columns and rows vary wildly across a dataset of many independent tables. Consider the following abridged OCRed examples from the digikey catalogue (this work is for for componentdeal.co.uk):-
(TLDR: scroll to the bottom to see the segmented results and skip the hard bit :p)
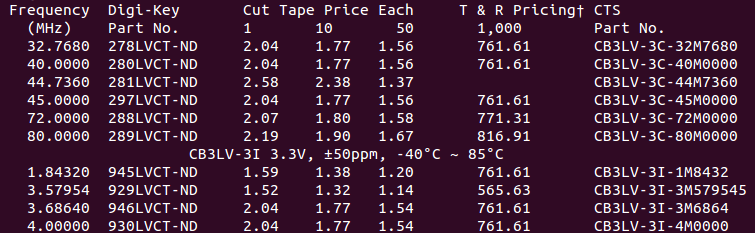
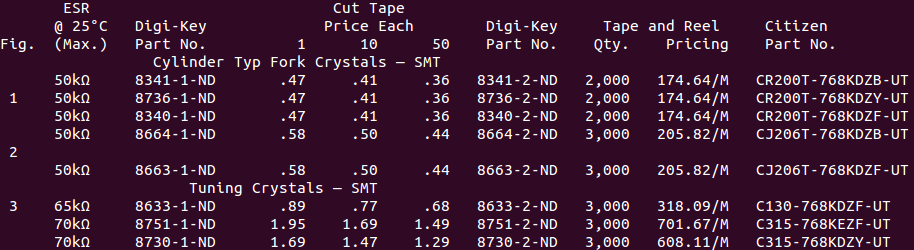
These tables have: differing spatial layout of header fields (e.g. “Cut Price Tape Each”), differing number of table header lines, different number of columns, and some rows are not data but actually hierarchical sub headings (e.g. “CB3LV-3I 3.3V, ±50ppm, -40°C ~ 85°C”). In the digikey world, ending in “-ND” is strong evidence that a token is a partnum, however, its not fool proof, as lots of non-partnums also end in -ND (its a huge catalogue). To decide whether “297LVCT-ND” is a product code, you need to reason over the entire table building up evidence.
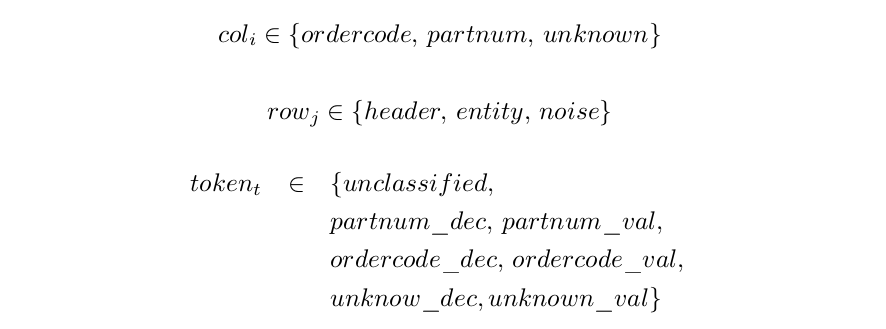
To do the inference I represent the table structuring elements (rows and columns) and the token labels as random categorical variables. A single character wide column is assigned a column type (ordercode, partnum) or unknown. A row is either a header, entity or noise. A token is either unclassified, a declarations of a column type (e.g. “Part No.”), or a value in a column type (e.g. “281LVCT-ND”).
The important thing in a table is that values and declaration tokens have to match types, and be consistent over an entire column. We can express these hard logical constraints using mixed integer programming (MIP). The first step is to encode the variables states into numerical variables. A categorical variable is split into a one-of-n vector encoding. For example, every column categorical variable becomes three integer variables each encoding a boolean state

We force one of the variables to be one by adding a linear constraint, ![]() for each column i . We repeat this for the row and token catagoricals.
for each column i . We repeat this for the row and token catagoricals.
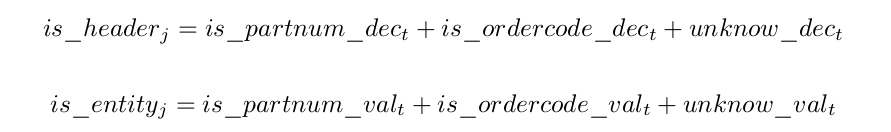
The next thing is to ensure that only declarations appear in header rows, and values in entity rows, for every row, j , and token, t .
The final set of constraints is ensuring each column contains declarations and values for a specific column type. Each token is one or more characters long, so each token intersects several single character wide columns. So for each token, t , and for every column intersecting that token, i we add the following constraints
![]()
(and the same for ordercode )
So at this point we have expressed the problem as a huge set of binary integer variables, with linear constraints between them. A MIP solver can now optimize any linear cost function involving those variables subject to those constraints. We choose our objective function to encode the probability of a particular labelling which we maximize to give the maximum likelihood estimate (which tells us which tokens are values) over all possible labellings.
Given a number of naive, independent, classifiers, their joint probability is their product, which is what we want to maximise.
![]()
The product term is not compatible with linear programming, so we note that the maximization result is not affected by taking logs, which usefully turns products into sums

This we can express as an objective function for our MIP. For this example I assign a probability of a token labeling based only on the content of the token. The three important cases I used were:
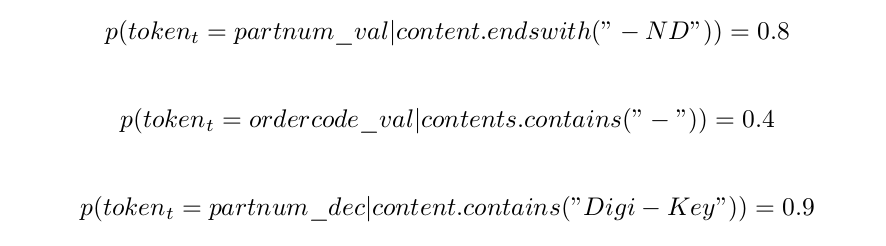
A catch all case when no specific clues are present is
![]()
You should theoretically fill in the missing combinations to make sure the probabilities add up to one, but in practice it does not matter too much (mine don’t).
So now we can express our maximum likelihood estimate objective function as
![]()
This is in the form of a summation of constants multiplied by single unknowns, which a integer programming package like PuLP can solve very quickly. I have coded up this example in python to demonstrate how easy it is to encode (see table_lp.py).
Whilst integer programming is NP-hard to solve in general, these problem instances are not pathological instances. My computer solves the MLE problems in 0.3 and 0.2 seconds respectively, despite their being 953, and 1125 unknown boolean variables to assign. The output on the examples above are shown below. If a token was predicted to be ordercode or partnum, in a header or entity row, it is color coded.
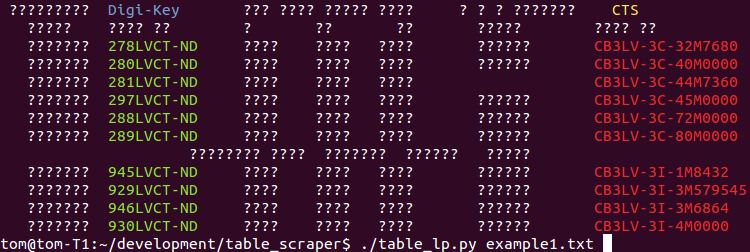
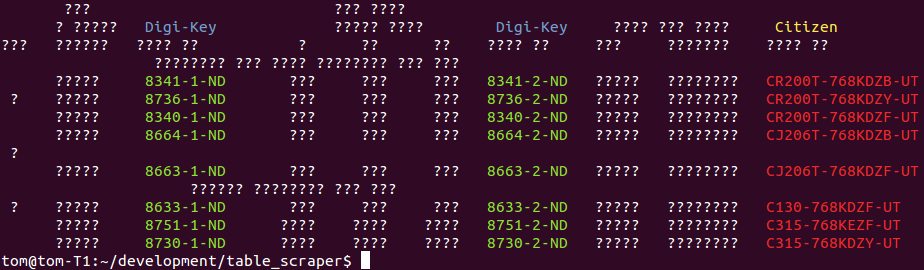
What is particularly cool in these examples is that the system has labelled the partnum header correctly despite the naive classier having no information about this class. Its also managed to successful disambiguate extraneous tokens that contain “-” depite the parnum classifier being particularly weak at classifying.
The combination of mixed integer programming and probabilistic reasoning is powerful. When hard domain constraints are integrated with probability estimates, you can yield strong classifiers from relatively weak signals. Furthermore these problems can be solved quickly, and thanks to decent linear programming front ends like PuLP, they are not hard to program declaratively. I expect this kind of declarative scraper to be more accurate, easier to maintain and easier to document than an equivalent procedural rule based scraper.
Further Reading:
There are two main math subjects going on here. The first is linear programming, which is normally used to work out where to build factories under the guise of “operations research”. The hard bit is expressing your domain, but Applied Mathematical Programming (1977) has a great chapter coving many tactics for encoding problems.
We are not however, deciding, where to build factories. Maximum Likelihood Estimation is chapter 1 of Bayesian statistics, but not normally expressed with rich constraints. The insight is that the MLE estimate for * independent* observations has a form compatible with MIP, so you can model cool things. Books on Bayesian statistics get too complicated, too quickly though, so I am struggling to think of a book that doesn’t go too abstract. This paper is a tutorial for psychologists that is about the right level.
This is a fascinating approach…In most use cases where I’d want to scrape a plain text table, the quantity of text is so great (thousands of pages) that I consider it fine to just hand-write the scraper and rules (mostly using regexes). It seems like an issue that could be solved with higher-level math though.
However, since you’re dealing with OCRed data, how does incorrectly-converted characters (numbers where there should be letters, etc.) affect the classifier algorithm?
I put it to you, that its impossible to write a regex for this kind of data. You lose positional context in a table with regex, so all you have to make the decision is the characters. This means you won’t be able to tell the difference between different numeric fields, and I also think you will have a really hard time even on part nums because the catalogue is so huge. So maybe with two regexes, one for the header and one for the table elements … maybe. Note sometimes an integer appears on the third row, sometimes as a price quantity break column header, and sometimes as a field value in a product row. Whether the third row is header or row is ambiguous.
Before you know it your regexes will be leaves buried in a nest of if else logic that was hand crafted in response to scraping challenges as they arose, which is very difficult to maintain. The approach I am suggesting is computationally more powerful because it is doing loopy probabilistic inference, AND the constraints are somewhat clearer specified. So this is the better approach for hard projects or long running projects.
My classifiers can deal with character noise in OCR because the classifiers emit probability distributions. For each word it outputs a probability for each possible class, so OCR noise can be accomidated as a diffusion of probability across the labelling classes.
Ah, I misspoke…Regexes are definitely not sufficient alone for all but the simplest cases. With tables in which columns may be blank, a regex will simply collapse those. My brute-force-primitive solution was to include some logic that would be calculated for each page. For example, using the headers (which, in a massive file, will usually be uniform across every page) as a guideline for bounds…at the very least, the headers tell you how many columns there may be.
But then you get into the problem of when the headers themselves are screwy…so again, moderately complicated cases require considerable logic.
What OCR package are you using? Have you tried using the hOCR output of Tesseract (or, if you prefer, reading the engine’s API directly) for the positional content? The engine already performs calculations to determine grouped text…in the case of table parsing, the bounds of each word/character in the physical document may be the lowest-hanging data fruit
so my OCR is pretty good at preserving layout, there is some other stuff going on at the front end. So the ASCII layout is great. Actually trying to detect the whitespace between columns was an early attempt I used to hook into the problem. But some rows are not product rows, and break any clear delimitation of the columns (see the examples). So I was about to try and correct that when I realise my logic was extremely conveluted just for detecting which token is in which column (if at all anything to do with columns)! I switched strategy and I really like the way it works now. Its aggregating all those indicators all in one go.
Fascinating article. But hard to read because of the 15+ typos in it – all of which would have been found by a spelling checker. All this fancy machine learning stuff is not very useful if the results can’t be communicated professionally. Next time, please run your writing through a spelling check before posting it.
yikes you were not wrong! I wrote it in latex because of all the math… I really thought I was a better speller than that … but lesson learnt, thanks for letting me know.
Hi, I find your approach very interesting, and I have many potential applications for this algorithm at the start-up I am interning at. Unfortunately, the math is a little bit over my head. Could you please recommend resources I could use to good up to speed on this content?
I added a Further Reading section.
Tell you bosses I am always open for remote consultation! The hard part is getting the modelling started in a domain. Once people see the examples they can usually add to it quite easily.
impressive!
hey Martin I added a further reading section. I think the applied math chapter + PuLP would be good for your use case.
Great article. Do you have any recommendations for OCR programs/services to get high quality readings of tabular data?
I tried some tools in the past but was never happy with the result. The idea is to OCR receipts you get from every day shops. So two, maybe three columns of data.
I can’t share the OCR approach used in this work, but it would not apply to your data anyway. I have used tesseract before, but I tend to scrape digital stuff that’s been rendered by a computer so there is zero scan noise.
Receipts will be trickier due to scan noise, different fonts etc. But OCR is like any AI program, garbage in, garbage out. OCR can be improved by, buying a better scanner, trying different lighting approaches. You might try aligning the digital scans manually to see if bad alignment is a cause of issues. You could try manually fiddling with the contrast curves to make the letters stand out better from background. You could try noise reduction techniques to pre-process the data. If letters are fuzzy you might try a filter to sharpen the images. My larger point is that the OCR software might be good, but the data you are providing it is the problem. Try a few manual pre processing techniques to understand how the OCR pipeline can get damaged, then write custom software to avoid those issues.
The job of OCR software writers is to go from shapes to characters. However, OCR is a practical setting is likely to have domain specific noise added to the shapes. The OCR people can’t predict every possible noise profile for every possible domain, so its the application writer’s job to understand their domain (like receipts), and try to get the data into the format OCR people can work with. If I had to second guess the biggest issue in receipts (dangerous, because I have not seen your data), it would probably be low contrast between foreground and background due to liberal use of printer ink. Bump up the contrast maybe.
Anyway, I am glad you enjoyed the article! I hope I might have given you some ideas on your problem.